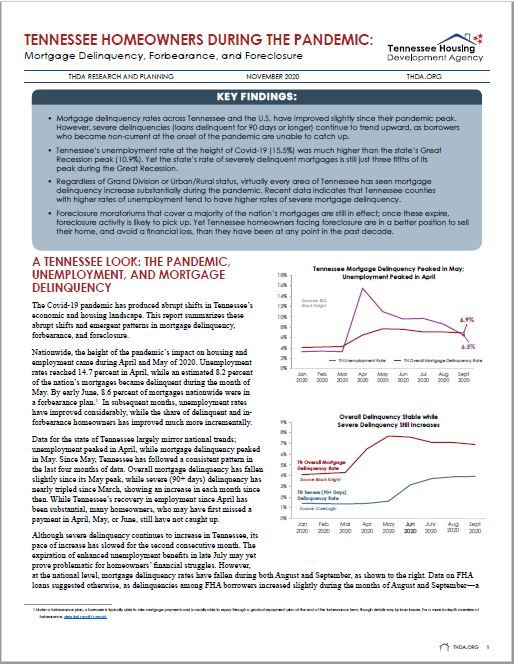
Tennessee Homeowners During the Pandemic: Delinquency, Forbearance, and Foreclosure
THDA Research and Planning, in response to the Covid-19 pandemic, re-tooled what was formerly a quarterly report, into an ongoing monthly snapshot. Following February 2021, the reports will be updated semi-annually, as the Covid landscape and the data show meaningful shifts. The below reports summarize data on delinquency, forbearance, and foreclosure across Tennessee, comparing the state to the national data. Additional resources are provided at the end of the report, linking to local-level data.
 |
Mortgage Delinquency and the Pandemic: An UpdateTennessee and the U.S. are facing two concurrent, but seemingly contradictory, trends in mortgage delinquency. The overall share of homeowners behind on their mortgage has shrunk markedly and consistently, having declined for six consecutive months, amounting to 34 percent of the initial increase caused by the pandemic. The share of severely delinquent borrowers, however, has barely rebounded from its pandemic peak, and when isolating to FHA borrowers, who tend to be lower-income, the data do not even show the beginnings of a possible recovery. [February 2021] |
 |
Tennessee Homeowners During the Pandemic: An End-of-Year UpdateMonths after the Covid-19 pandemic disrupted employment at historic rates, the full scope of its impact on Tennessee homeowners is still unknown--largely due to foreclosure moratoriums that remain in effect through January and February. Mortgage delinquency rates continue to trend downward in the last two months, while severe (90+ days) delinquency rates also appear to have peaked and are now trending downward. [January 2021] |
 |
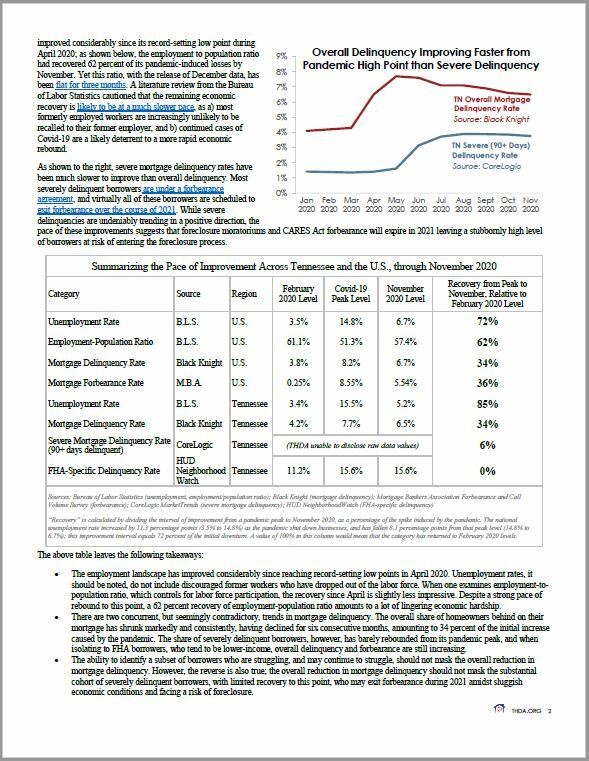
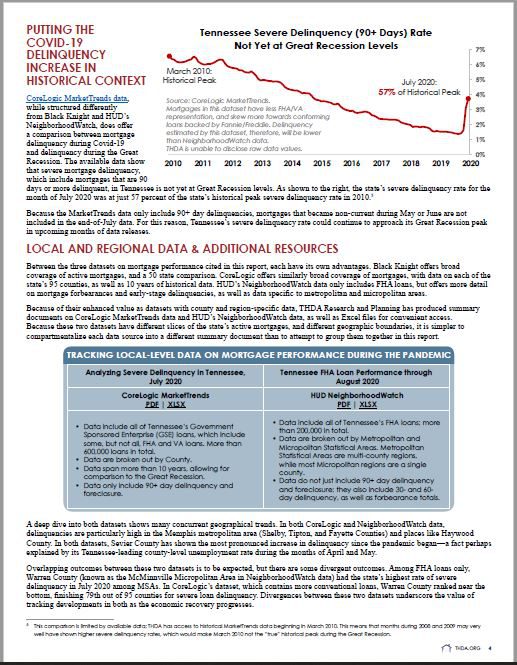
Tennessee Homeowners During the Pandemic: Why the Outlook is Favorable, Compared to the Great RecessionForeclosure moratoriums that cover a majority of the nation’s mortgages are still in effect; once these expire, foreclosure activity is likely to pick up. The pandemic environment remains full of uncertainty going forward. Yet Tennessee homeowners facing foreclosure are in a better position to sell their home, and avoid a financial loss, than they have been at any point in the past decade. For further discussion of why this is the case, as well as a deeper look at the pandemic's impact across Tennessee's 95 counties, view the full report. [December 2020] |
 |
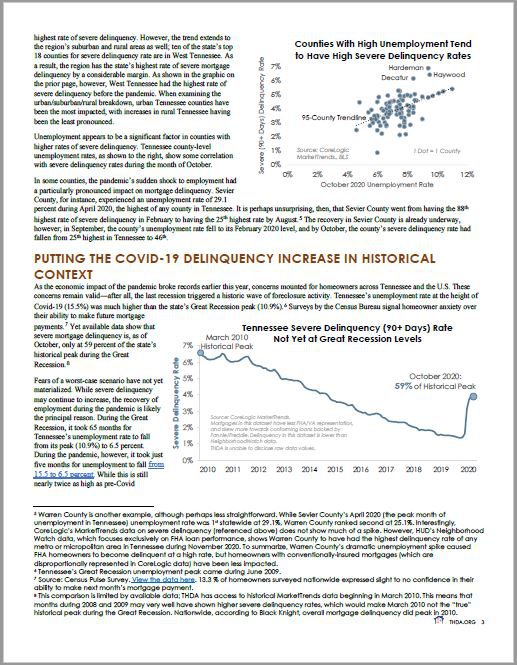
Tennessee Homeowners During the Pandemic: Covid-19 vs. the Great RecessionTennessee’s unemployment rate at the height of Covid-19 (15.5%) was much higher than the state’s Great Recession peak (10.9%). Yet the state’s rate of severely delinquent mortgages is still just three fifths of its peak during the Great Recession. For further discussion of why this is the case, as well as a deeper look at the pandemic's impact across Tennessee's 95 counties, view the full report. [November 2020] |
 |
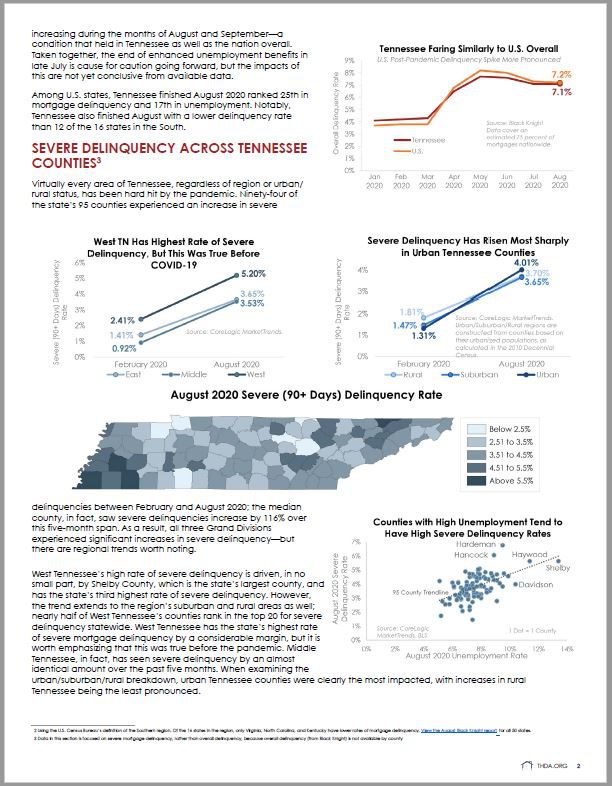
Tennessee Homeowners During the Pandemic: Overall Delinquency Down Slightly, but Severe Delinquencies Up Across the StateUsing data published in September 2020, this report report finds that mortgage delinquency has fallen slightly, both in Tennessee and the U.S., from its April/May peak, corresponding with the height of the pandemic's shock to employment levels. Severe delinquencies, however, remain on the rise and could continue to climb in upcoming months. The report also finds severe delinquency to have increased in virtually all areas of the State, regardless of geography or Urban/Rural status. [October 2020] |
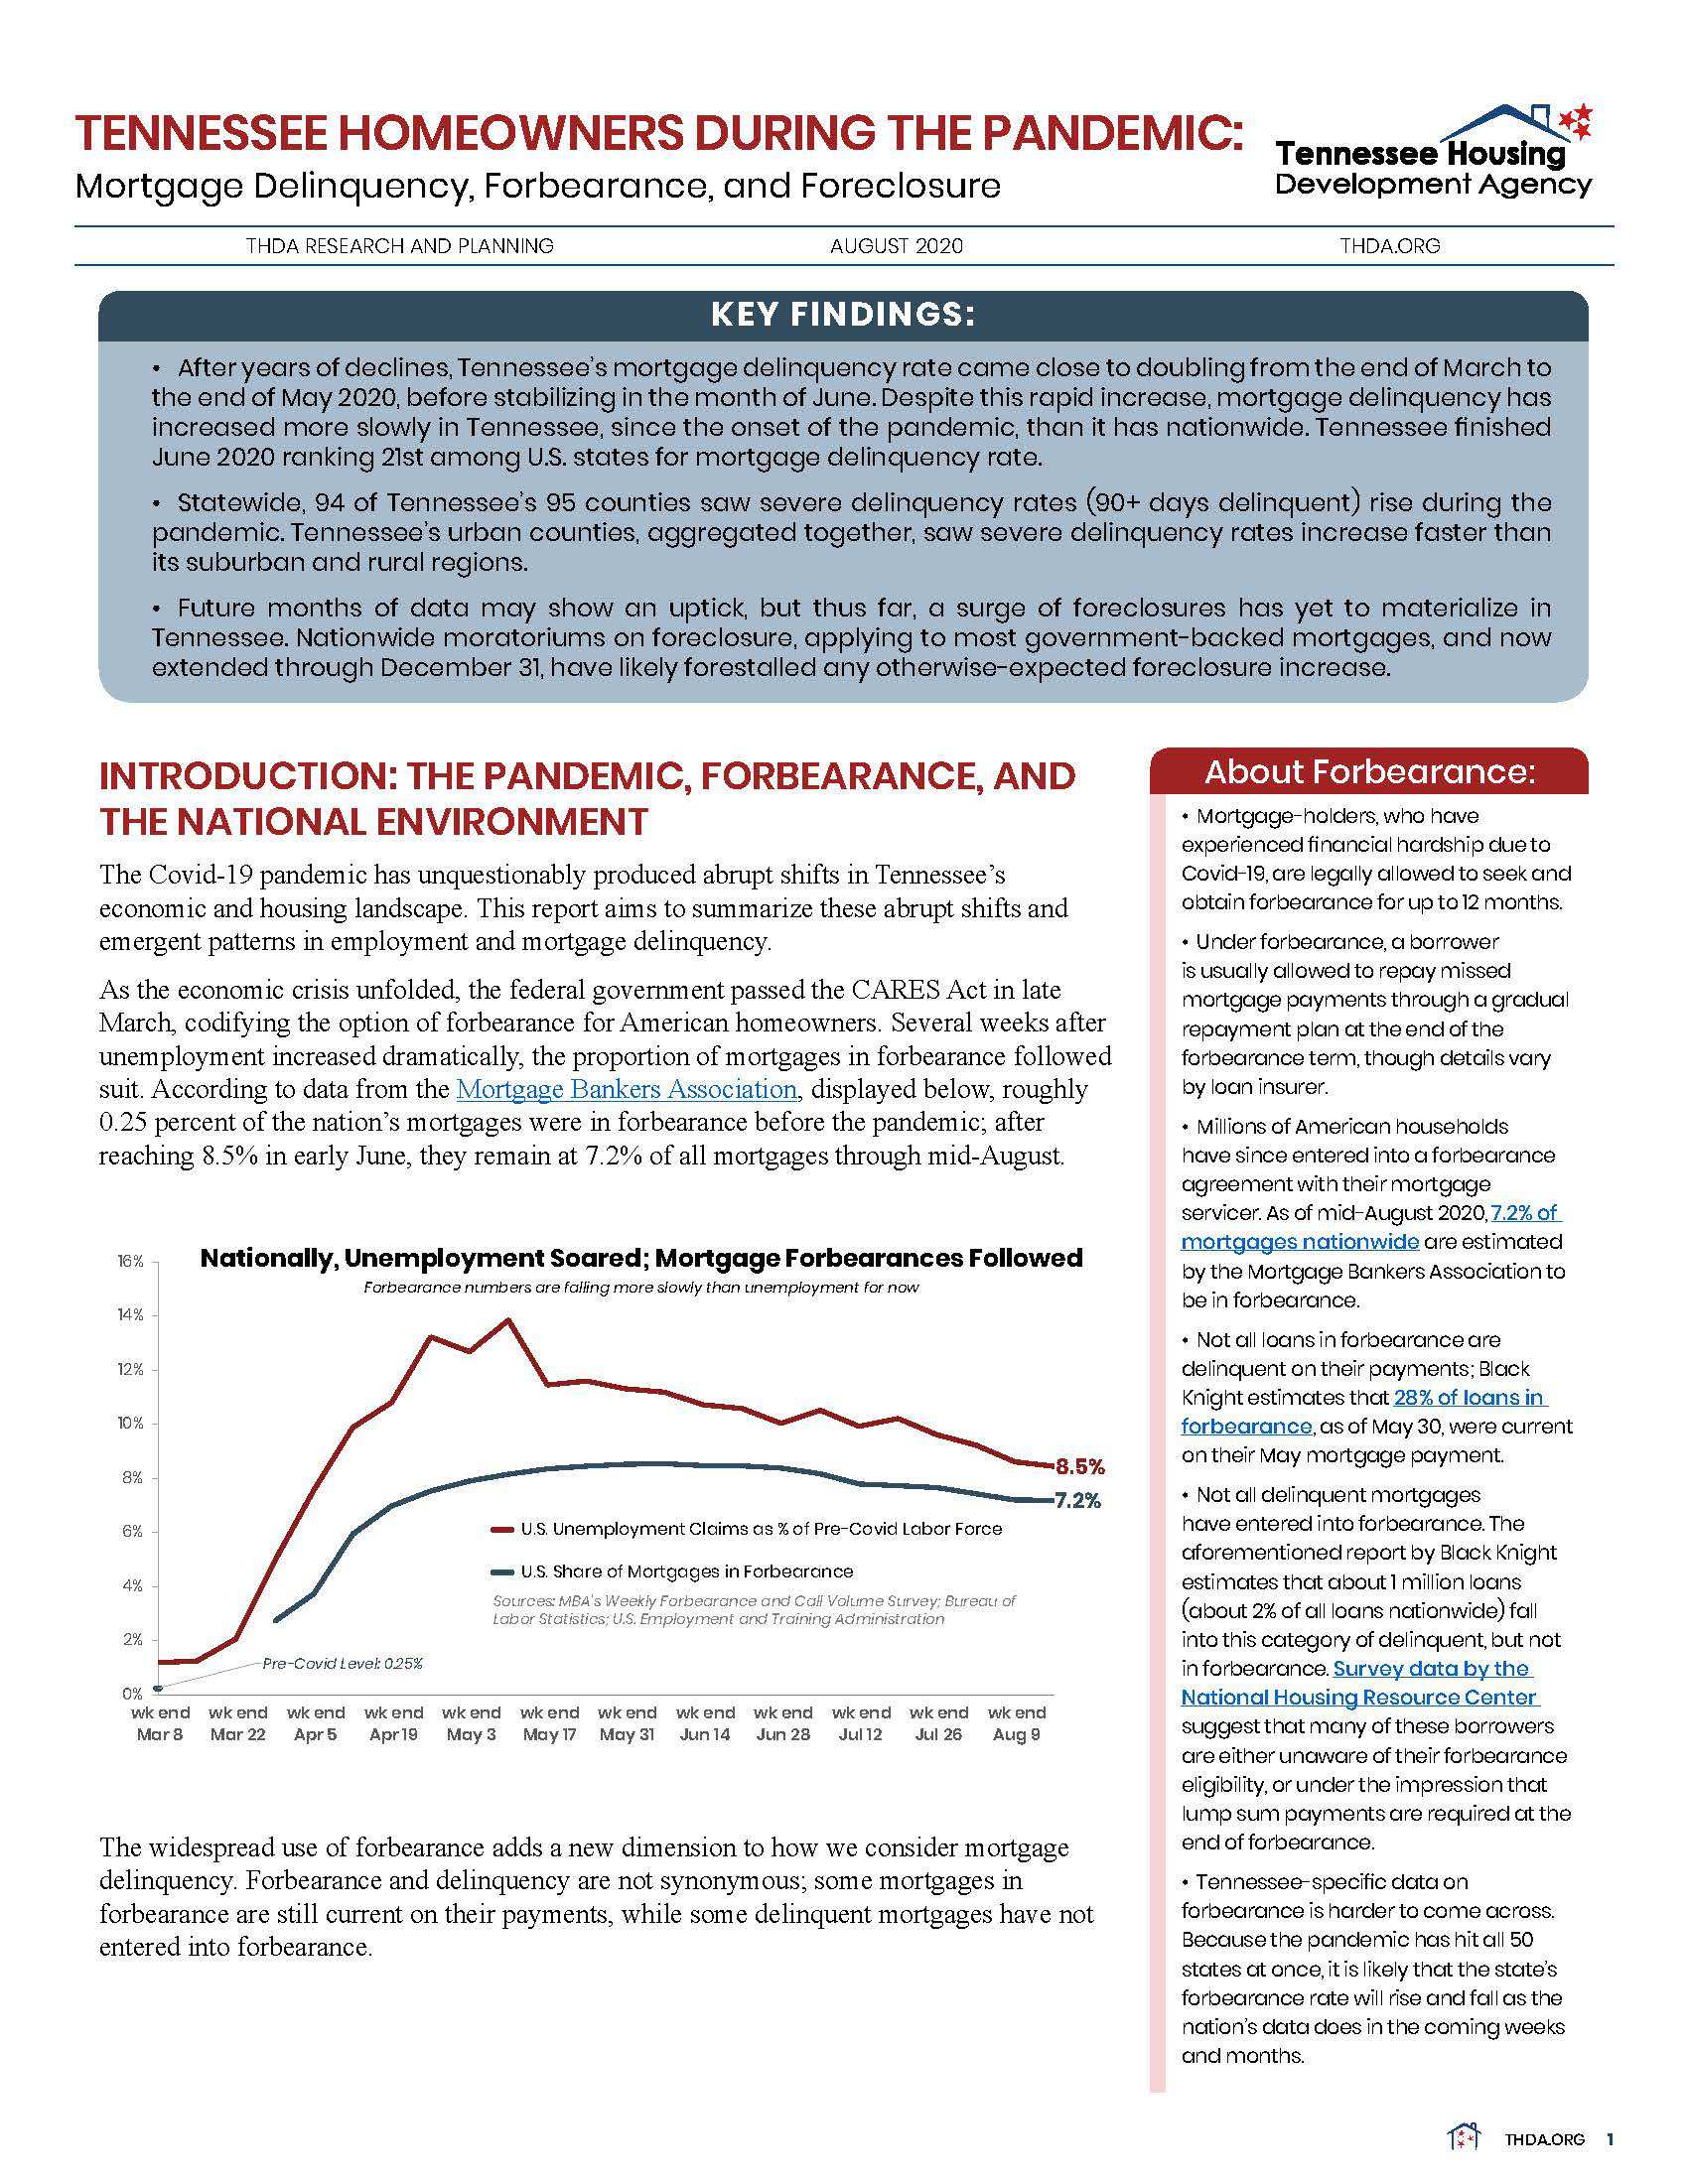 |
Tennessee Homeowners During the Pandemic: Delinquency, Forbearance, and ForeclosureThe Covid-19 pandemic has unquestionably produced abrupt shifts in Tennessee’s [September 2020] |
THDA Research and Planning, from 2015 through 2019, produced a quarterly Foreclosure Trends report with data from CoreLogic®.
Quarterly Reports
2019: 1st Quarter | 2nd Quarter | 3rd Quarter | 4th Quarter
2018: 1st Quarter | 2nd Quarter | 3rd Quarter | 4th Quarter
2017: 1st Quarter | 2nd Quarter | 3rd Quarter | 4th Quarter
2016: 1st Quarter | 2nd Quarter | 3rd Quarter | 4th Quarter
2015: 1st Quarter | 2nd Quarter | 3rd Quarter | 4th Quarter
Methodology: How We Calculate the Foreclosure Index
Previously, reports were published using data from RealtyTrac®.They are listed below:
Calendar Year
2013 | 2012 | 2011 | 2010 | 2009 | 2008
Quarterly
2014: First Quarter | Second Quarter | Third Quarter
2013: First Quarter | Second Quarter | Third Quarter | Fourth Quarter
2012: First Quarter | Second Quarter | Third Quarter | Fourth Quarter
2011: First Quarter | Second Quarter | Third Quarter | Fourth Quarter
2010: First Quarter | Second Quarter | Third Quarter | Fourth Quarter
2009: First Quarter | Second Quarter | Third Quarter | Fourth Quarter
2008: First Quarter | Second Quarter | Third Quarter | Fourth Quarter
Monthly Foreclosure Trends
2011: Jan. | Feb. | March | April | May | June | July | Aug. | Sept.
2010: Jan. | Feb. | March | April | May | June | July | Aug. | Sept. | Oct. | Nov. | Dec.
2009: Jan. | Feb. | March | April | May | June | July | Aug. | Sept. | Oct. | Nov. | Dec.
2008: July | Aug. | Sept. | Oct. | Nov. | Dec.