Mortgage Lending Trends in Tennessee
The following reports provide an overview of residential mortgage lending patterns in Tennessee using the Home Mortgage Disclosure Act (HMDA) data, which is a very comprehensive data source on mortgage applications during the calendar year. They will be updated annually as the data become available.
 |
2023 Home Loan Trends in Tennessee (using HMDA Data)
[November 2024] |
 |
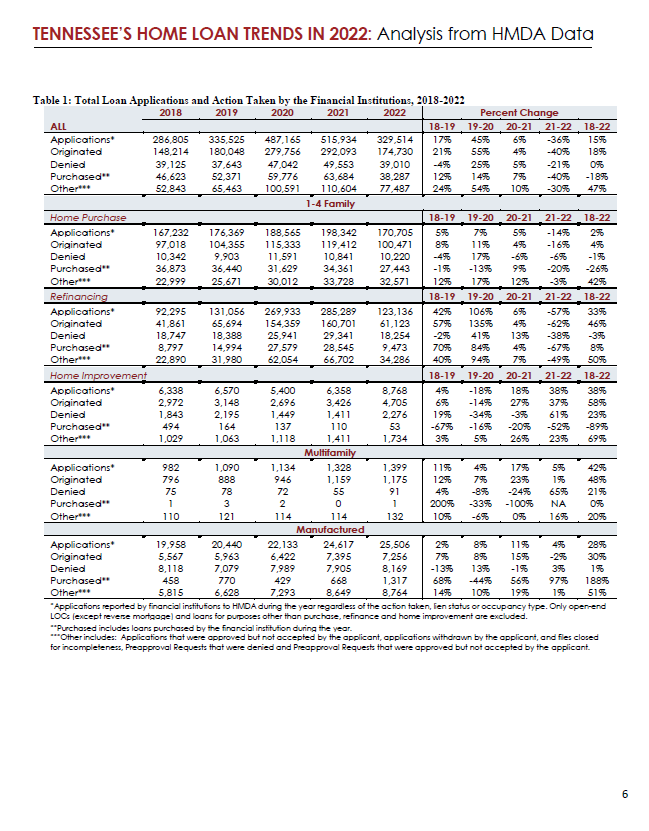
2022 Home Loan Trends in Tennessee (using HMDA Data) Key findings from this year's HMDA report indicate that 2022 is the first year since 2011 that home purchase mortgage loan originations in Tennessee declined from the previous year. Nonetheless, mortgage activity in Tennessee is still consistent with long-term trends present since 2004, demonstrating a steady increase yielding twice the mortgage volume in 2022 than in 2011. High interest rates and increased home prices made the cost of homeownership significantly increase in 2022. In 2022, the median estimated monthly payment for principal and interest increased to $1,625. The share of loans for Black borrowers remained steady, slightly decreasing to 7.3% in 2022 from 7.6% in 2020 and 2021. Although Black borrowers still received the greatest share of higher-priced loans in all five years, the proportion of them receiving higher-priced loans declined against the increasing trend for all other races in 2022. [November 2023] |
 |
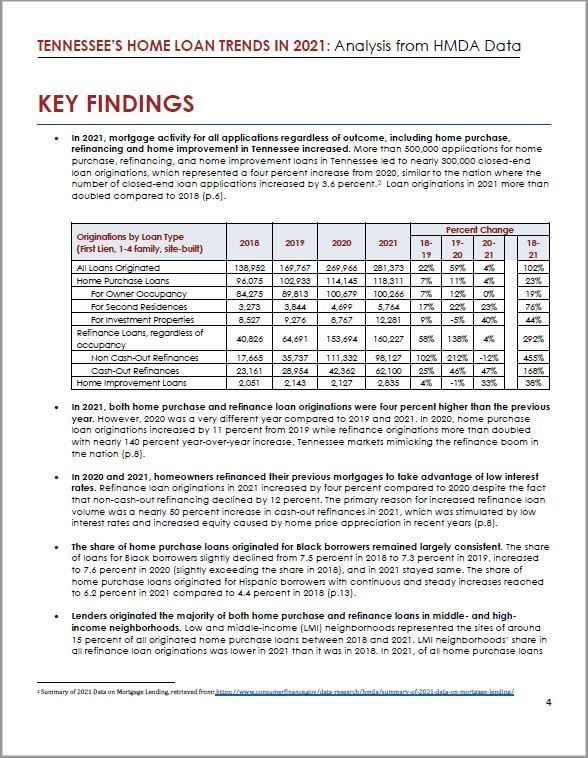
2021 Home Loan Trends in Tennessee (using HMDA Data)In 2021, mortgage activity for all applications, including home purchase, refinancing and home improvement in Tennessee increased, regardless of outcome. Both home purchase and refinance loan originations were 4% higher than the previous year. In 2020 and 2021, homeowners refinanced their previous mortgages to take advantage of low interest rates. Refinance loan originations in 2021 increased by 4% compared to 2020 despite the fact that non-cash-out refinancing declined by 12%. The primary reason for increased refinance loan volume was a nearly 50% increase in cash-out refinances in 2021, which was stimulated by low interest rates and increased equity caused by home price appreciation in recent years. [December 2022] |
 |
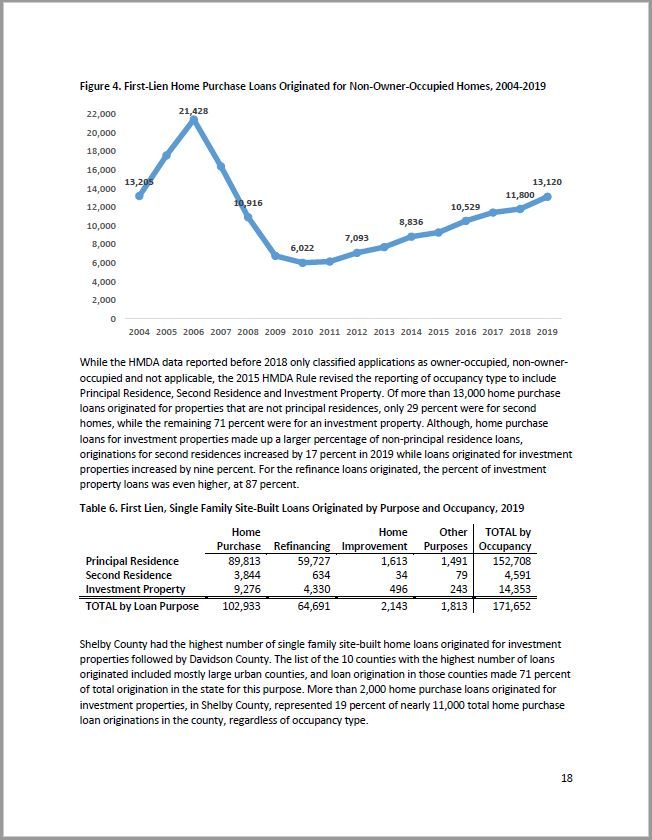
2019 Home Loan Trends in Tennessee (using HMDA Data)Before Covid-19, mortgage lending data showed that loan originations of all types were on the rise in Tennessee. Home purchase loans, refinances, and home improvement loans all increased from 2018 to 2019. In particular, traditional home refinance loans were tremendously responsive to lower interest rates, preceding the pandemic environment. For a comprehensive view of how this varied across geography, demographic group, and income ranges, view the full report. [December 2020] |
 |
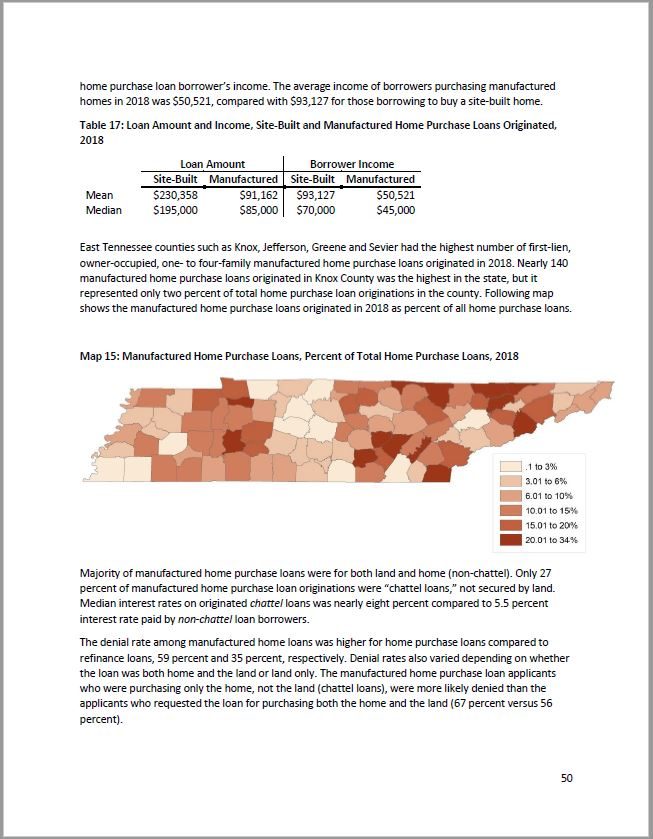
2018 Mortgage Lending Trends in Tennessee (using HMDA data)In 2018, mortgage activity (all applications; regardless of outcome; including home purchase, refinancing and home improvement) in Tennessee declined from the prior year, similar to national trends. The source of this decline in overall activity was a decrease in overall refinance activity. The 2018 HMDA data have improved detail from prior years; for the first time, this report summarizes information on the prevalence of cash-out refinancing (as opposed to traditional refinances) and borrower DTI ratios. [September 2020] |
